Rating CRE loans according to risk is a long-established practice in the financial industry, however it has become much more important because of the increasing requirements for quantitative risk reporting, e.g., for Basel capital and stress testing. Over the last few decades it has become conventional to rate loans according to their probability of default (PD) and loss given default (LGD). For simplicity, in this article we focus on the PD metric and how that should be interpreted for commercial real estate loans.
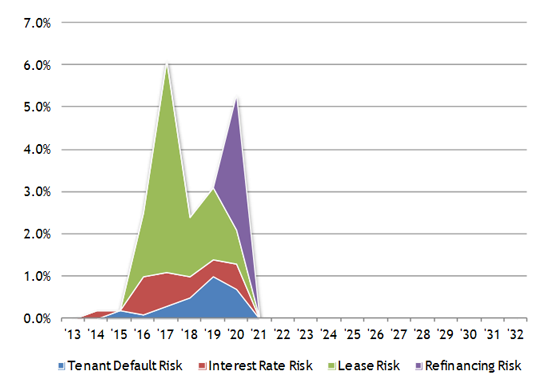
For standard retail and commercial loans and for corporate bonds it is assumed that there is a smooth progression in risk from the first year to subsequent years, therefore quoting the first year's PD is sufficient to uniquely assign the loan to a particular rating or grade. However commercial real estate (CRE) loans are different because they are generally long-term loans with jagged risk profiles over time. The peaks and troughs of the profile are dictated by the deal's structure and the interaction between the financing and features of the underlying property assets, for example expiration of swaps, lease breaks, rent renewals and refinancing patterns. A typical risk profile for a commercial real estate loan is shown below:

As an example of the disconnect between the first year PD and the overall risk, consider a property with a single large creditworthy tenant. This loan may have much lower risk in the first year than a property with 5 smaller units, however if that large tenant's lease expires in year three, the risk will peak and may be much higher than that of the diversified property. Similarly an interest-only loan will have low PD in the first year, but a spike of refinancing risk at maturity and therefore its low PD in the first year does not reflect the overall risk.
Such fundamental differences in the risk profile means that the year-one risk does not represent the risk of the loan as a whole and therefore there is not an obvious mapping between CRE loans and other loan-types. One solution would be to take the average PD over the life of the CRE loan, but this is an unfair comparison with commercial loans because for a commercial loan the year-one risk is typically lower than the average risk over all of the years. The consequence would be that CRE loans of 'the same risk' would be assigned higher PD and therefore a higher capital than 'similar' commercial loans.
The key to the solution is to define what is meant by 'similar'. The most direct comparison is to compare the loss over the life of the loan. More specifically, we want to find a commercial loan whose risk profile is such that an investor would be indifferent as to whether they would buy that commercial loan or the CRE loan. Since we are dealing only with the PD portion of the risk, we can ignore the effects of EAD, LGD and correlation. If we assume the LGD is a standard 100%, the expected loss on a loan is as follows:

Where:
 is the number of years to maturity
 is the probability of default in year
 is the cumulative probability of default up to the beginning of year
 is the balance at the beginning of year
  in the nominal case
 is the interest payable
 is the discount rate
For simplicity (and practicality1) we can assume  and
and  equal zero, so the equation collapses to:

The next step is to compare the NPV of loss for the CRE loan with the NPV of loss for a reference set with the same balance profile. The reference set can be a set of bonds or loans with their grades and defined PD profiles over time. For this explanation let us assume the reference set is a set of commercial loans. By comparing the NPV of loss for the CRE loan against the NPV of loss for each grade of the commercial loans, we can see which commercial loan grade best matches the CRE loan over the life of the loan. We can then take the year-one PD from the best matching commercial loan grade to be the equivalent PD for the CRE loan2. The overall result is that a CRE loan with a given reported year-one PD will have the same NPV of loss3 as a commercial loan with the same year-one PD.
Fundamentally, the true risk is the irregular risk profile over time, and for detailed analyses that is the risk profile to be used, but for risk approximations such as portfolio reporting and Basel capital, this mapping approach provides CRE business units with an apples-to-apples comparison with the other asset types.
Dr. Chris Marrison
CEO, Risk Integrated
Contact Risk Integrated today
Want to learn more about this article? Speak to our experts today.
Contact Us- Operationally this approach is sufficiently advanced compared with common practice that the extra refinement of deciding the discount rate is more complicated than the added value. Similarly including the spread leads to a more complex analysis with essentially the same outcome. ↩
- As an added refinement, if the CRE loan falls between two commercial loan grades, we can interpolate the one-year PD to be between them ↩
- if the LGD, EAD and correlation were the same. ↩
