PORTFOLIO ANALYSIS
SFS for Generation of Performance Metrics
Financing complex credit transactions such as CRE or PF is in many ways unique. The deals are highly structured with multiple layers of subordination, which leads to peaks and troughs of risk over time. Simply examining the first year’s risk is not sufficient to characterize the whole deal so the risk analysis for specialized finance assets must take into account the time varying structure of the risks.
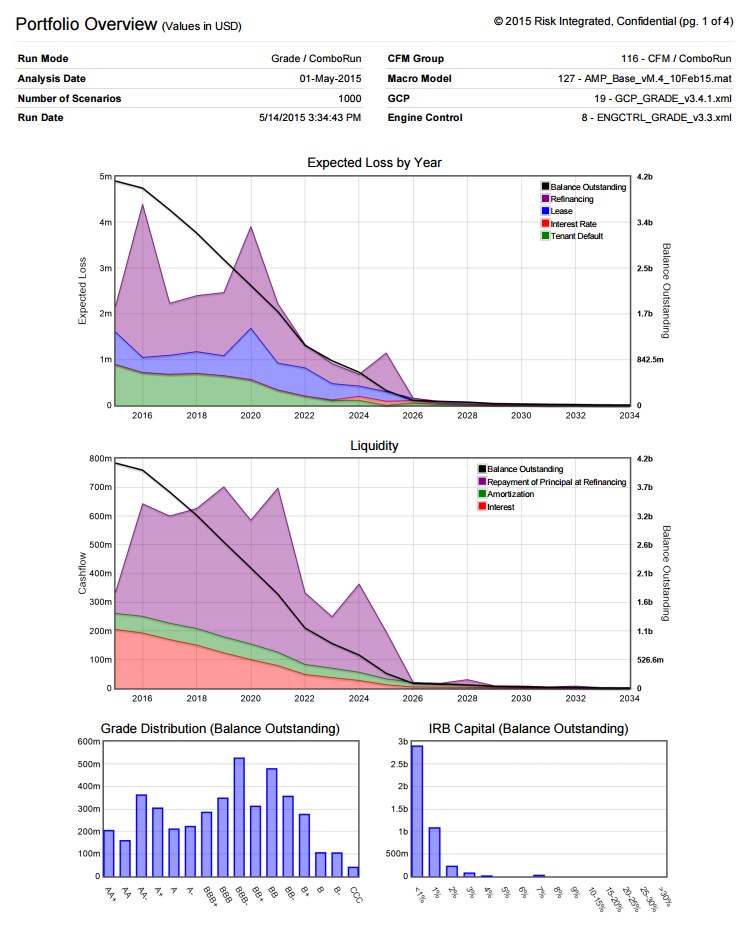
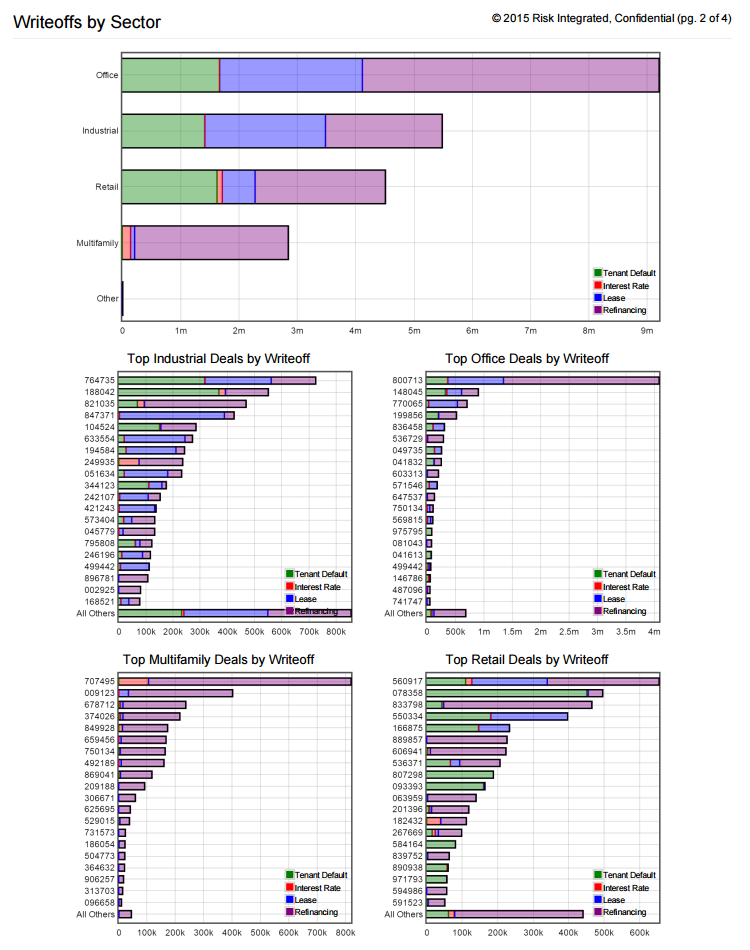
The Specialized Finance System (SFS) supports two main types of portfolio analytics: credit analysis and performance analysis. In credit analysis the main metrics are centered around default (e.g., probability of default and exposure at default). This approach is most commonly used in banks. The graphs below show typical results of credit analysis.
Portfolio Overview
Asset managers more commonly come from a bond or equity trading background and are concerned with performance against benchmarks and about changes in value.
With the SFS, performance calculations are easily generated and programmed into the cash flow models which can accommodate as many loans as required. The model calculates classical performance metrics such as:
- Value
- Market return
- Current return
- Total return
- Duration
- Convexity
Portfolio valuation is based on the NPV of the principal repaid, including interest and fees prior to disbursement. The first set of calculations breaks out the cashflows to the owner of the loan (usually the bank). The principal flow to owner is calculated as the difference between the principal owned at the start of the time step less the amount owed at the end of the time step. Next, the interest and fees that flow to the owner, along with the amount of interest and fees paid, is multiplied by the ownership of the loan. Loss of principal to owner due to foreclosure is also calculated. The risk-free rate used for the NPV calculation is looked up from a yield curve; the credit spread is the spread on the loan. For the floating rate period of a loan, the rate used is simply the short term rate of the loan.
Market return is calculated as the change in the NPV between value at the start of the time step and the value at the start of the next time step, minus any disbursements of principal, plus any repayments of principal. The total return is the sum of the market, the interest and fees to owner, plus any write-off amount. The NPV, market return and total return are converted into the dominant currency per loan and summed.
The SFS accommodates different types of derivatives that are part of a cashflow group or in use at the portfolio level. Currently, the list includes:
- Interest Rate Caps
- Interest Rate Floors
- Interest Rate Collars
- Interest Rate Swaps
- FX Forward
- FX Swap
- Total Return Swap (TRS)
All the performance results listed above are gathered for the value, current return, market return, total return, Macaulay duration, modified duration, convexity and administration costs. They are summed up in categories for IPRE, construction loans, swaps and equity investments, serving as the basis of the portfolio analysis provided on a portfolio by the SFS.