Introduction
The Financial Accounting Standard Board's (FASB's) new IFRS-9 and the Current Expected Credit Loss (CECL) approach requires banks to deduct the Expected Loss from the balance-sheet value of a loan. Furthermore, it requires the Expected Loss to be estimated using a reasonable forecast of the future market. Now consider this recent quote on Bloomberg:
'Apartment rents in cities such as New York and San Francisco will need to fall as much as 15 percent for a glut of high-end developments to be absorbed, according to billionaire real estate investor Richard LeFrak'
This leads to questions as to how much difference do the forecasts make to the CECL and what kind of deals are most affected?
This short paper outlines the answers to those questions for commercial real estate by testing a range of mean-reverting forecasts against typical example deals. The approach used to assess the risk is the comprehensive cashflow simulation embedded in the Specialized Finance System (SFS). The simulation tests the deals under thousands of dispersed random scenarios, centered around forecasts for inflation, interest rates, capital values, rental rates and vacancy rates.
Analysis
Three simplified forecasts are used for illustration here:
- Basecase:
- Simulation is around a flat forecast relative to today
- Mildly negative central forecast:
- Interest rates, inflation and vacancy rates increase 0.25% per year for three years and then flatten
- Capital values and rental rates fall 2.5% per year for three years and then flatten.
- Moderately negative central forecast:
- Interest rates, inflation and vacancy rates increase 0.5% per year for three years and then flatten
- Capital values and rental rates fall 5% per year for three years and then flatten.
The loans are all for a Boston office with an LTV of 75%, initial DSCR of 1.35, 20-year amortization, maturity of 5 years with rents equal to the current market rents. The differences are as follows:
- Loan A: Fixed rate loan and one fixed lease with 0% probability of tenant default
- Loan B: Fixed rate loan and one fixed lease with 1% probability of tenant default
- Loan C: Fixed rate loan and four equal leases with a 1% probability of tenant default, with one lease expiring in year three and the others expiring after year eight
- Loan D: Floating rate loan and four equal leases with a 1% probability of tenant default, one lease expiring in year three, the others expiring after year eight, and all leases repricing to the market annually
Table 1 shows the net present value of loss as a percentage of the initial balance. Clearly the loan type and forecast makes a very great difference to the Expected Loss. Note especially the effect of including the creditworthiness of the tenants in Loan B compared with Loan A.
| Loan: | Base | Mild | Moderate |
|---|---|---|---|
| A: Fixed, Fixed, 0% PD | 0.2% | 0.8% | 2.4% |
| B: Fixed, Fixed, 1% PD | 1.0% | 2.2% | 6.1% |
| C: Fixed, Fixed, 4 Tenants | 0.4% | 1.7% | 5.2% |
| D: Floating, Floating | 0.4% | 5.0% | 18.2% |
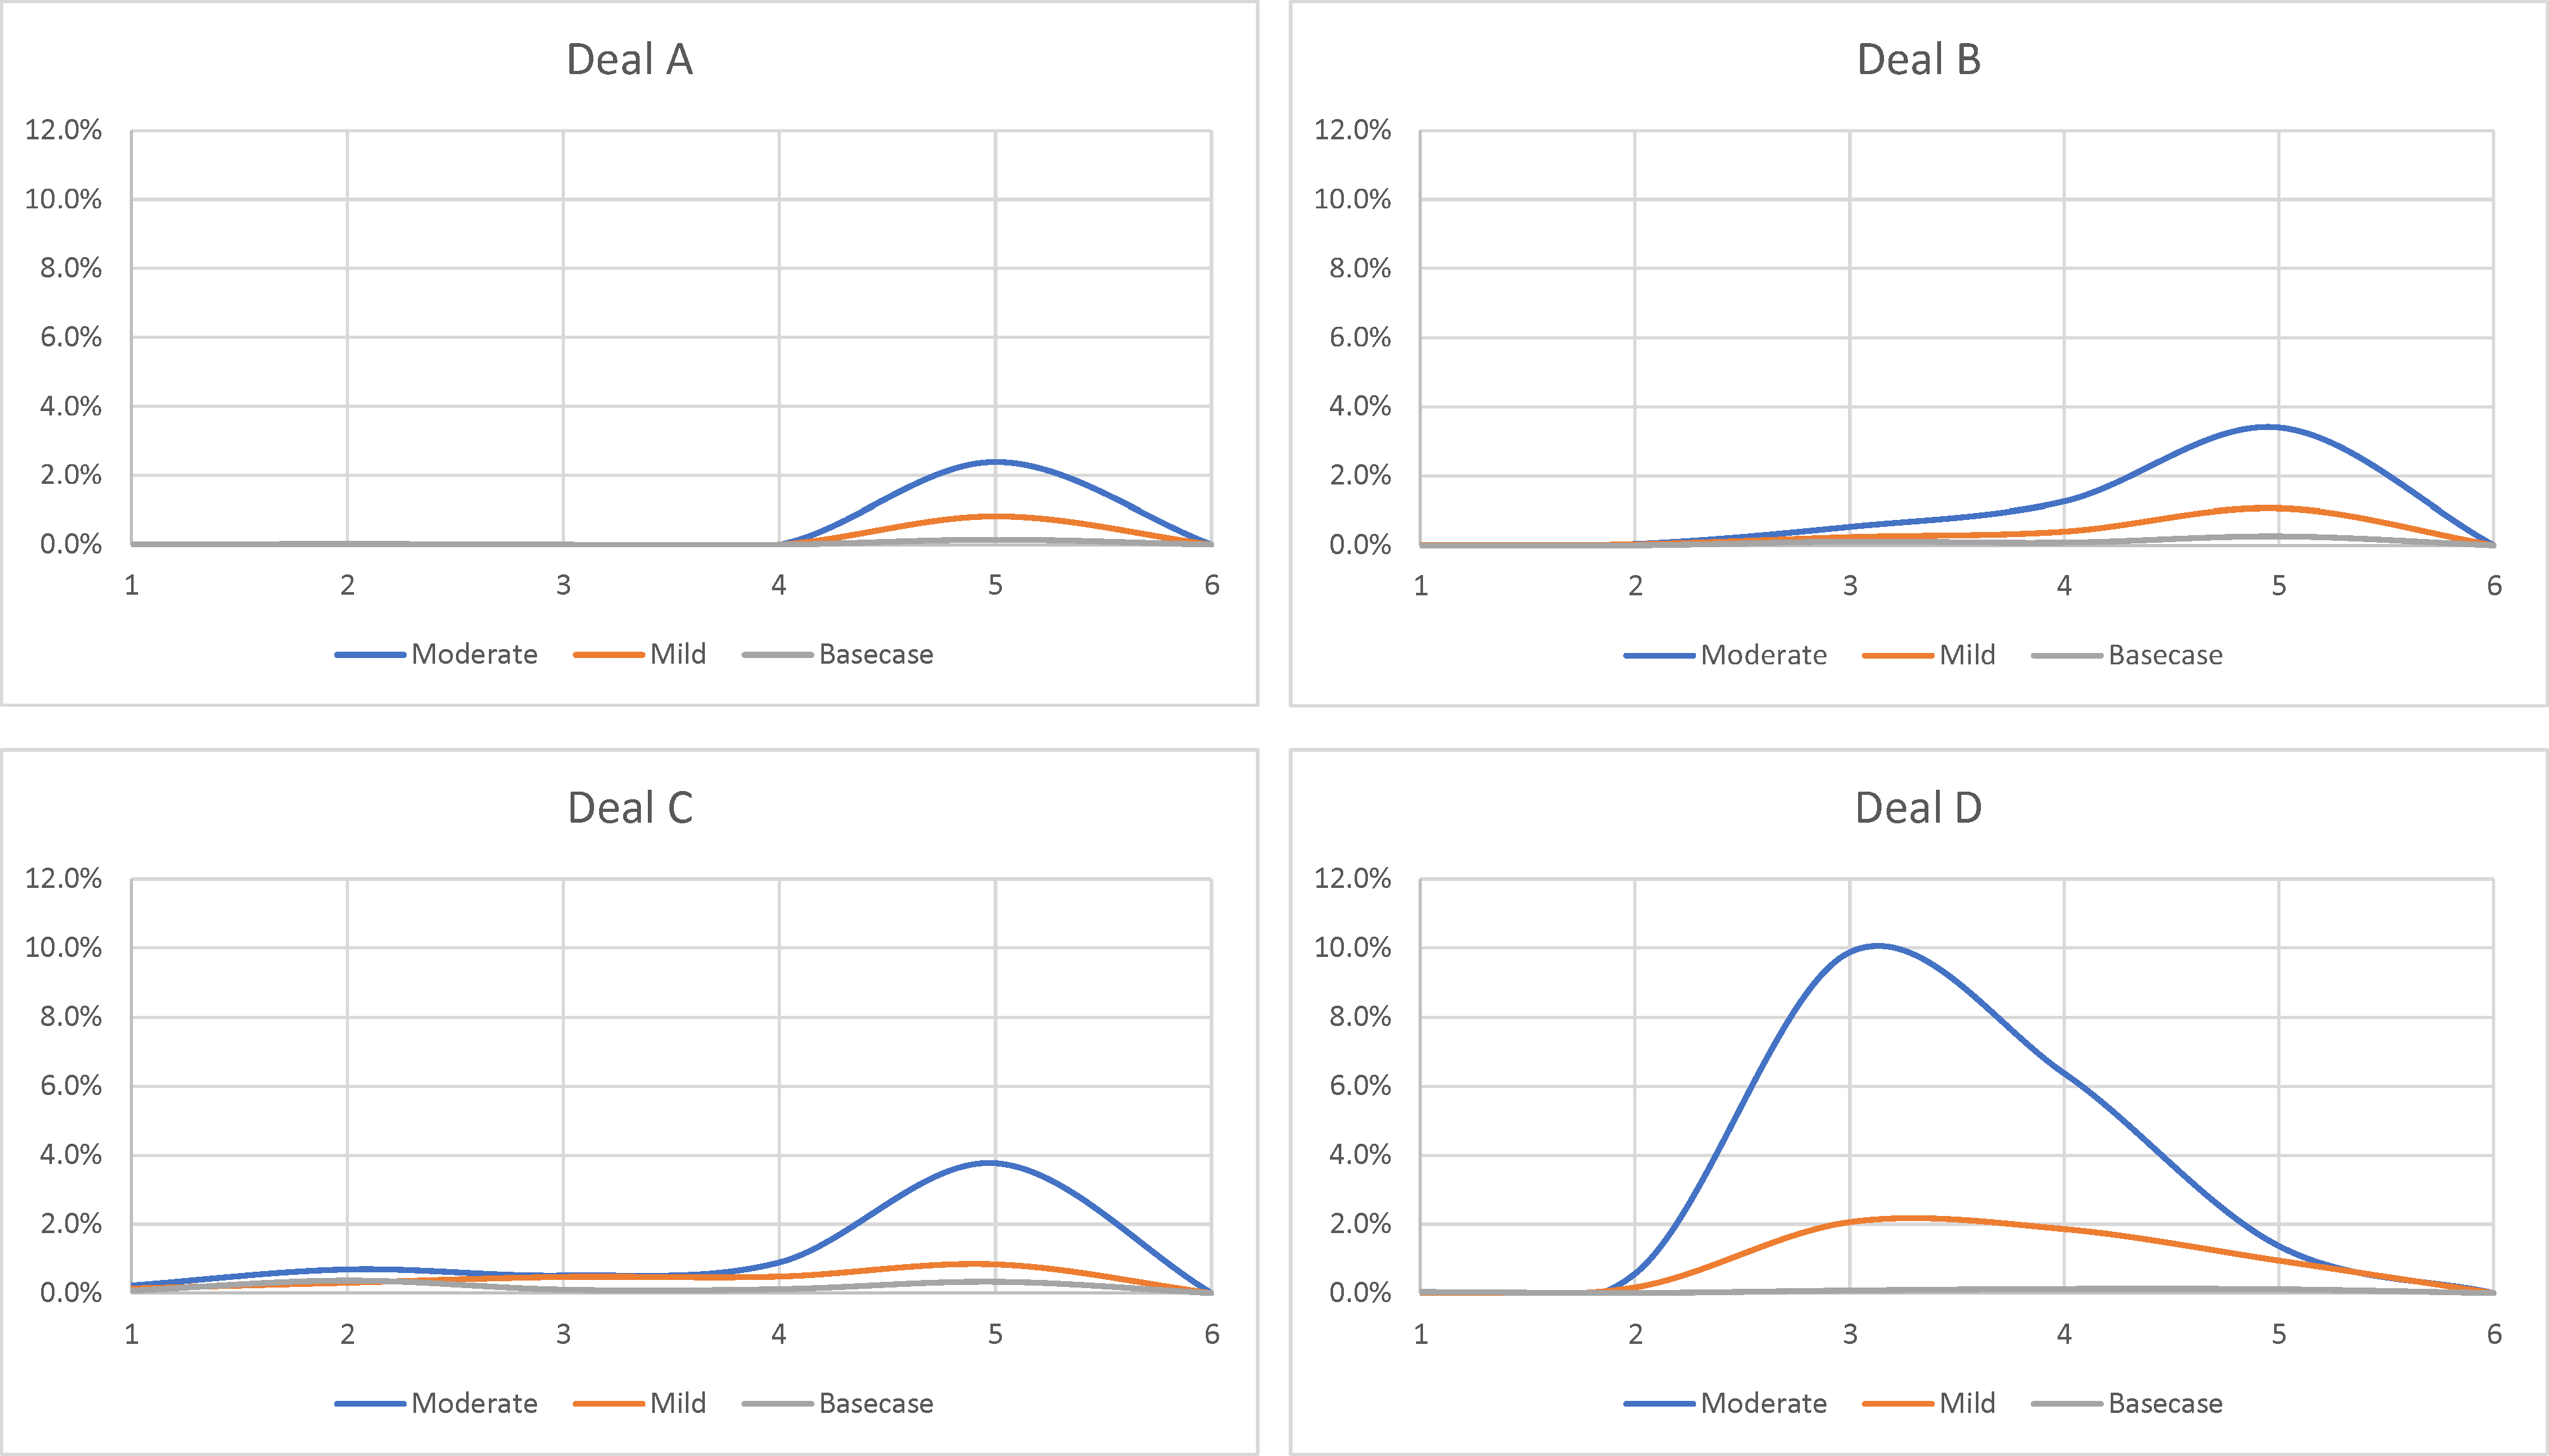
To give deeper insight, the graphs below show the CECL projected over 5 years for each of the forecasts. For most of the deals the most important risk is refinancing, however Loan D suffers badly in the year of the lease expiration.
Conclusions
This brief analysis illustrates that forecasts have a significant influence on the CECL and that the degree of influence depends on the deal type and information included in the analysis. With capital and accounting both depending on the measurement of risk, there are plenty of opportunities for arbitrage and mispricing. The next paper shows the effect of risk-mitigants such as covenants.
Dr. Chris Marrison
CEO, Risk Integrated
Chris.Marrison@RiskIntegrated.com
Contact Risk Integrated today
Want to learn more about this article? Speak to our experts today.
Contact Us