Introduction
One of the options for allocating regulatory capital under Basel III and Solvency II is to use the 'slotting' approach, whereby the capital for each asset is assigned according to a small number of slots, e.g., low, medium, and high risk. This creates specific behavior-incentives for the institutions under slotting and specific arbitrage opportunities for those institutions with more advanced approaches. This paper looks at the 'game' set up by this set of incentives. The paper first summarizes the arbitrage opportunities and then explains the underlying rational. The opportunities are best explained on a graph.
Graph 1. Cost of Funds for Each Level of Measured Risk
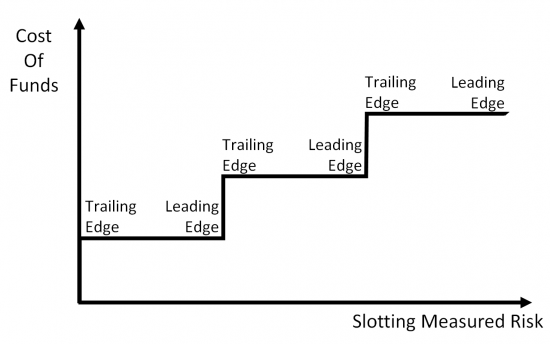
In Graph 1 the x-axis is the riskiness as judged by the slotting criteria. The y-axis is the cost-of-funds. In Graph 1 the slotting cost-of-funds depends simply on the assigned capital per slot, multiplied by the required return on equity1. For later discussion, the points on the steps are labeled as leading-edge and trailing-edge.
Graph 2. Range of Cost of Funds for Actual Risk
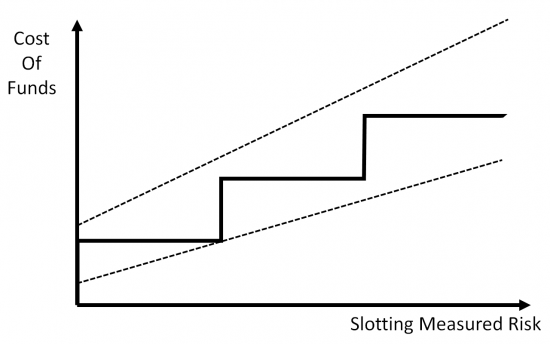
Graph 2 adds a range for the cost-of-funds. This range shows what the cost-of-funds (COF) would be if the risk was perfectly known. The true COF is different to the slotting COF for two reasons. Obviously the first reason is that the slots produce steps. The second reason is that the simplified risk assessments such as the typical slotting criteria do not capture all the possible risk variations within a deal: in a previous paper2 we demonstrated how the tenant, property and financial structures can produce great differences in risk for commercial property deals that seem to have identical risk according to conventional measures such as Loan to Value (LTV) and Debt Service Coverage Ratio (DSCR).
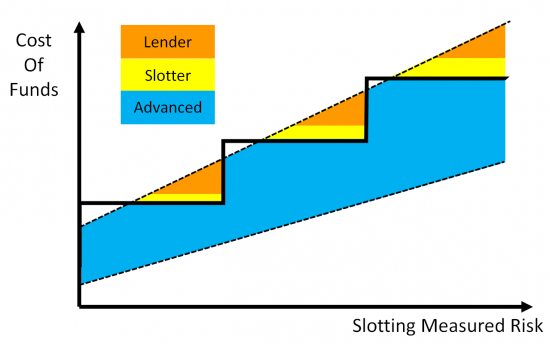
Graph 3. Areas of Incentives to Lend
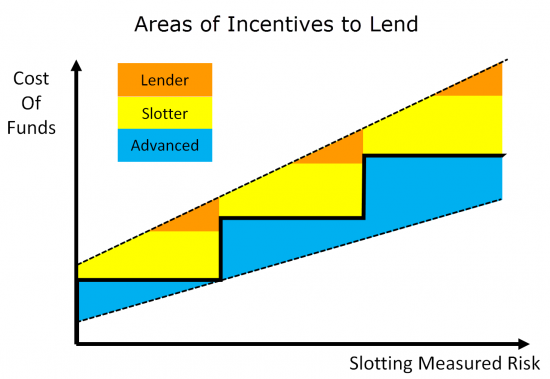
Graph 3 shows the regions where individual lending officers in slotting institutions are incentivised to lend, where slotting institutions as a whole are incentivised to lend, and where advanced institutions are incentivised to lend. Graph 3 illustrates lending officers being most strongly incentivized to do higher-risk deals at the leading-edge of each slot, where risk and prices are high and the cost-of-funds is relatively low (orange). Institutions using slotting are generally incentivized to do a broader range of high to medium-risk deals at the mid to leading-edge so long as prices are above the slotting cost-of-funds (yellow). Advanced institutions are incentivized to lend along the trailing-edge where risk is low, prices are relatively high and slotting institutions have little interest (blue). Advanced institutions will be priced-out of the yellow region because the cost of slotting capital is less than the cost of the actual risk. This is possible for the advanced institutions because they have a lower cost-of-funds for lower-risk deals, especially at the trailing-edges.
Derivation of Results
Let us now look at the assumptions and propositions leading to these results. We start with the following assumptions:
- There can be a difference between the risk assessed according to the slotting criteria and the actual risk; with simple slotting criteria giving rise to larger potential divergence.
- There are four primary types of players in this game: the customer (or borrower), the individual lending officer, the institutions subject to slotting capital and the 'advanced' institutions.
- The advanced institutions are those whose external cost of capital matches the actual risk. This may be foreign institutions allowed to use the Advanced Basel III approach, insurers using an advanced approach, non-bank financial institutions, hedge funds, or even crowd funding. Or it may be achieved via financial engineering, securitization and derivatives.
- The achievable margin (or price) that a customer is willing to pay is linked to the true risks and benefits as recognized by the customer. Therefore, more-risky deals will tend to have higher prices.
- Customers desire the maximum number of 'concessions' where those concessions come in the form of either lower price, or more favourable terms such as higher loan limit, less additional collateral or fewer covenants, i.e., higher risk to the lender.
- Lending officers want to maximize profitability per deal, and maximize the probability of closing a deal.
- The probability of a lending officer closing a deal, in competition with other lenders, increases with the degree of concessions.
- The profitability depends on the size of the loan and the margin minus their cost-of-funds3.
Given these assumptions, the largest gap between the slotting cost-of-funds and the actual risk is at the leading-edge of each step and with the highest unmeasured risk compared with the slotting criteria. Lending officers at slotting institutions should therefore try to move any deals that are on the trailing-edge so that they go down to the leading-edge of the previous step, thereby significantly increasing the measured profitability of the deal for a small reduction in risk. They can do this by tightening those parameters of the deal that are considered in the slotting criteria, e.g., the LTV. To retain the customer, in compensation for tightening in these slotting dimensions the lending officer can allow some reduction in price, and offer concessions in the unmeasured dimensions of risk, e.g., reduced guarantees or reduced covenants.
Deals in the mid-point of a step should be given concessions and moved up the leading-edge of that step, because even though the risk increases, the cost-of-funds does not increase as you move from the mid-point to leading-edge. This means that for the same cost-of-funds, the slotter can get more margin and give more concessions to win the deal. So overall, slotters have a strong incentive to do deals at the leading-edge of each step, and lending officers at those slotting institutions have an incentive to do deals with the highest unmeasured risk. This movement is illustrated by the red arrows in Graph 4 and the resulting portfolio distribution for the slotters is illustrated by the skewed distributions below, pushing up against the leading-edges.
Lending officers can also aim to seek-out customers who are on the leading-edge according to the slotting criteria, but who have high unmeasured risk, e.g., unrated tenants, short leases, market resetting leases, and small number of undiversified tenants with go-dark clauses. Such customers will know they are risky and be willing to accept a higher price than would be indicated by the slotting criteria.
Graph 4. Moving the Distribution of Deals to Increase Measured Profit
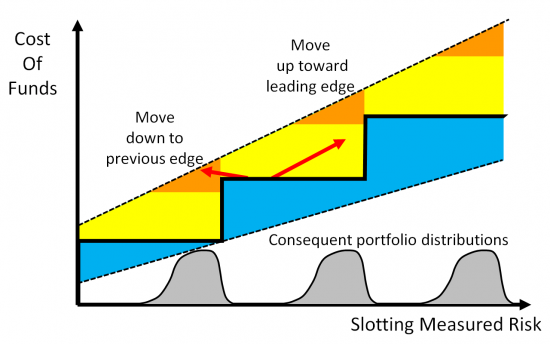
The slotting bank as a whole has a strong incentive to do deals at the leading-edges, because that is where there is the best ratio of income to regulatory capital. However, if the bank is allowed to not apply the use-test4, it may have its own models for assessing the risk used in calculating the cost-of-funds for the lenders. In this case there is much less unmeasured risk, and the lending officers have a more balanced incentive to do deals up and down the risk spectrum around that leading-edge. But even with their own assessment of risk, slotting institutions will still only want to lend where the actual risk is equal to or greater than the slotting risk: giving the yellow areas in Graphs 3 and 4. This leaves the blue area for the advanced players. In this area the advanced players can lend at low risk, with good returns relative to their advanced cost-of-funds, to customers who are of low interest to institutions.
The result is that slotters hold assets grouped towards the leading-edges, with higher risk than that reflected by the regulatory capital. One possible response by regulators to 'correct' for this risk concentration might be to increase the amount of capital per slot. Such an apparently conservative approach would simply intensify the need for slotters to focus on high-risk assets and enlarge the area where advanced institutions can lend at a lower rate, as illustrated in Graph 5.
Graph 5. The Effect of Making Slotting Capital 'More Conservative'
So pulling this together, what are the lessons for the players within this game?
- Each slotter should define the criteria for its slots to minimize the assessed riskiness and allow assets to be moved easily towards the leading-edges.
- Slotting lending officers and institutions should try to shift their assets to be at the leading-edge of slots.
- If allowed, slotting institutions should try to focus their lending officers up and down the spectrum of risk by charging a cost-of-funds that reflects the full risk and minimizes the amount of unmeasured risk, i.e., incentivise the lending officers for negotiating a better deal than the competition, rather just a deal with more concessions.
- The distortion between the leading and trailing-edges will be minimized if the step sizes are as small as possible.
- The distortion will also be minimized if the slotting criteria reflect the true risk so far as possible and are not simplistic 'blocky' rules allowing for a large amount of unmeasured risk.5
Conclusions
This paper describes how to exploit the weaknesses in slotting regulations. Such exploitation is to the detriment of the banking system and creates the opposite of the regulators' intentions but is the consequence of the game which is set-up by using slotting. Institutions and lending officers can be exhorted to 'do the right thing' and keep the risk of long-term loss to be in-line with the capital held, but if personal financial incentives and shareholder pressures are pushing individuals and institutions to take risk beyond the measured capital, then they are in an unusually conflicted situation. It is not wise to set up a game in which personal financial benefits are at odds with the benefits of the institution and society. To the extent that regulators set up such a game, they must expect the players within it to maximize their personal positions. This paper, although simplistic, should be useful in helping to understand the underlying dynamics of this game.
Dr. Chris Marrison
CEO, Risk Integrated
Chris.Marrison@RiskIntegrated.com
Contact Risk Integrated today
Want to learn more about this article? Speak to our experts today.
Contact Us- The cost-of-funds will also depend on factors such as the rate at which the bank can borrow debt to match the term and rate structure of the loan, the operating risk capital, and the bank's expected return on equity.
- Beyond the Simplicity of DSC and LTV, Risk Integrated, October 2013
- In commercial real estate lending the cost-of-funds is a much more immediate driver than the actual risk because the actual risk is rarely manifested. For example, with US credit cards, the average charge off from 1995 to 2005 was 500 bps, and the peak was 950 bps in 2009, so in 'normal' times a credit card lender experiences 50% of the risk of peak times. With CRE in the same period the average charge off was 10 bps and peak was 230 bps in 2009, i.e., in 'normal' times CRE lenders only experience 4% of the peak loss. Peak losses happen so infrequently that the cost-of-funds provides a much more immediate driver than the prospect of actual losses.
- The use-test is that a bank should use the same model for both pricing and regulatory capital. This 'use' shows that the bank has trust in the model. If the bank had to link its price to simple slotting criteria it would distort the pricing.
- The ultimate version of these last two points is that the steps are infinitely small (smooth) and the risk criteria are assessed accurately.