Risk Methodology

Risk Integrated Applies Artificial Intelligence to CRE Risk

Risk Integrated has exploited the advances in machine learning (ML) to characterize the credit risk of commercial real estate lending. This has been achieved by using Risk Integrated’s comprehensive cashflow and risk simulation models in the Specialized Finance System (SFS). With the SFS we generate a massive dataset for pre-training the machine learning models and predict default events based on the characteristics of the underlying properties, leases and loans. A combination of Neural Networks and Fine Decision Trees were found to give the best characterization of the complex nonlinear, discontinuous risk profiles of commercial real estate transactions. This pre-training of the ML models has the advantage of improving the results with the finite real-world data.

In addition to pre-training ML models for credit risk data, Risk Integrated has adopted the machine learning approach to enhance the SFS by greatly reducing the time to get the results of the complex simulation models. Full simulation models have the great advantages of capturing all the details of complex commercial real estate structures, but on-the fly simulation of thousands of detailed scenarios can take several minutes. To speed the computation time, we have trained an ML network on the SFS to emulate the results. Emulation with machine learning has the great advantage that after training, evaluation of the risk requires a single pass through the neural net rather than running thousands of complex scenarios. This computation requires only milliseconds and greatly enhances the ability to run optimization analyses on large portfolios using the full sophistication of the underlying SFS analytics.

Based on these successes, Risk Integrated is now applying its AI tools to other aspects of transforming the commercial real estate market.

Dr. Chris Marrison
CEO, Risk Integrated
Chris.Marrison@RiskIntegrated.com
About Risk Integrated
Risk Integrated delivers [...]

May 21st, 2018|

The Effect of Tenant Defaults on CRE Loans

Introduction
In lending to commercial real estate (CRE), it is clear that the credit-worthiness of the building's tenants influences the overall risk of the deal. But then the question arises, "To what extent is a tenant's credit-worthiness important?" This paper answers the question by taking a series of deals and assessing their risk for different levels of tenant credit-worthiness. We also look at examples of how the impact the tenant quality is different for different levels of loan-to-value, number of tenants, and rental rates.
Base Deal
The first step is to define a standard deal and then assess the risk of the deal given different probabilities of the tenant defaulting (PTD). The standard deal is chosen as follows:

Property: Office in NY valued at $10,000,000 with prevailing market rent of $700,000/year
Lease: One tenant, paying $700,000/year (i.e., currently at market rent), expiring in 8 years
Loan: Balance of $7,000,000, paying 5% fixed, maturing in 10 years with 25 year amortization

The lowest PTD is set to be 0.1% and is then repeatedly doubled to create a range up to 51.2%. The risk is then assessed using Risk Integrated's Specialized Finance System (SFS), which runs a Monte Carlo simulation of a detailed CRE cashflow model to capture all property and loan details. Chart 1 shows the profile of the annual probability of default (PD) of the loan until the loan's maturity. For this graph, the PTD is set to be 1.6% in the first year.
Chart 1: Probability of Default Profile for the Base-deal with PTD=1.60%

In Chart 1 we see the following:

In year 1 the PD of the deal is 0.44%, i.e., much lower than the tenant's PD of 1.6%. This is because it is often possible to replace [...]

February 8th, 2016|

Cost-of-Funds for Commercial Real Estate

Introduction
This paper gives a brief introduction to cost-of-funds, (also known as transfer pricing) and the difficulties of setting the cost of funds for commercial real estate (CRE) lending operations. It then suggests a relatively straightforward approach which avoids these difficulties.
The Importance and Difficulty of Setting the Cost-of-Funds
The Cost-of-Funds (CoF) is the rate charged by the institution’s central treasury on money they give to individual lending units when those units request funds to lend on to customers. The CoF is the primary cost used in measuring a business unit’s profitability and typically it directly impacts the compensation of the lending teams. It therefore acts as a strong incentive in defining the nature of the assets being originated. Very simply:

The CoF has four potential components:

The risk-free rate for the term and rate profile of the loan to the customer
An operating cost
A subsidy from senior management to guide the relative growth of businesses
The cost of risk

This paper is focused on the cost of risk. A common practice is to link the cost of risk to the capital to be held for the asset. Pricing according to capital has several problems and is particularly difficult for CRE as CRE loans have long-terms and are highly-structured with time-varying risk profiles. Pricing according to the regulatory capital is especially problematic because regulatory capital typically only reflects the average risk of similar assets. The objective of regulatory capital is to ensure that the portfolio as a whole is backed by sufficient capital so regulatory capital does not necessarily reflect the risk of individual assets, and typically does not capture the changing risk profile of CRE assets over time. Regulatory decisions to require additional safety may also mean [...]

August 3rd, 2015|

Dissecting CRE Loan Risks - Lease, Tenant, Interest Rate and Refinancing Risk

Introduction
This paper discusses an approach for dissecting CRE Loan Risks -- determining the relative contributions of lease risk, tenant risk, interest rate risk and refinancing risk for CRE assets. The approach applies to both individual loans and portfolios. The paper also discusses potential risk mitigation strategies based on this information.

Risk models typically give single numbers for the probability of default and loss given default. More advanced models also provide the annual risk profile, identifying spikes in the risk associated with the structure of the deal or portfolio. With cashflow simulation we can go a step further and cut apart the causes of risk, e.g., into lease risk, tenant default risk, interest rate risk and refinancing risk. This identification of the risk sources provides lenders with valuable information as to how they can mitigate the risks, rather than just accept the risk grade.

This analysis is used at two levels: for individual deals and for complete loan portfolios.
Individual report example

Portfolio report example

Examples of these reports can be downloaded with this article below.
Risks to an individual deal
This individual deal report shows that there is a spike in lease risk in 2017, and then there is ongoing moderate risk due to tenant default and finally a large refinancing risk. If this deal was under consideration for credit approval, the risk may be mitigated by for example changing the amortization rate. If the asset was already in the portfolio there are fewer options for changing the loan terms but it may still be possible to add a swap for example to reduce the risk of a poor exit yield if interest rates rise. If there is no obvious way to change the structure, the strategy may be simply to [...]

May 26th, 2015|

Allocating CRE Risk Statistics to Quarterly Time Steps

Introduction
Exercises such as CCAR are asking for loss forecasts to be allocated to individual quarters. If the requirement is to fully characterize the quarterly risk for individual loans, it is necessary to use risk models that are built using quarterly time steps. However, by their nature, CRE loan losses respond more slowly to economic conditions than other types of loans and therefore at the aggregate portfolio-level the difference between quarterly and annual pictures is less marked than for other assets. This means that at the portfolio level, there are several effective approaches for allocating annual estimates of risk to individual quarters. This paper illustrates three example approaches.

As a base-line, consider the simple algorithm of dividing the annual loss by four and making the "flat" assumption that all the quarters within the year have the same loss. Figure 1 illustrates this for US Charge-offs from 1993 to 2013 and compares the actual quarterly data with the annual flat averages. By definition the annual averages track the overall trend, but there are some quarters where the loss spikes significantly away from the annual average. This difference is a combination of actual response to quarterly economic conditions, plus some idiosyncratic randomness (e.g., weather, a particular government statement, or the idiosyncratic risk of the individual loans).
Figure 1. US Quarterly CRE Charge-off rates compared with the Flat Annual Average

As alternatives to this flat allocation, three methods are illustrated in this paper:

Smoothed Allocation
Difference of Models
Model of Differences

Smoothed Allocation
Smoothed allocation takes the flat allocation for each quarter and then calculates the exponentially weighted running average to define a new quarterly loss. This has the effect of taking the "edges" off the flat average and, given the strong auto [...]

October 28th, 2014|

Default Behaviour for Commercial Real Estate Loans

This paper deals with the interaction of net operating income, debt servicing, collateral value, reserve accounts, the borrower's worth and the borrower's reputation and how those factors determine the willingness and ability to avoid default. This integrated analysis brings structure to long-standing debates as to the relative importance of the transaction vs. the borrower. The paper gives a structural model for thinking about when a CRE borrower will default and the factors affecting that decision. This framework has implications for both risk assessment and for the structuring of new deals.

Unlike standard retail and corporate loans, commercial real estate (CRE) loans have a significant amount of structure. The decision to default is often modeled as a function of the Loan to Value (LTV) and the Debt Service Coverage Ratio (DSCR). Together these factors are taken as the main predictors with some "fuzziness" as to whether a particular loan will default for any given combination of LTV and DSCR. This paper pulls apart the borrower's motives and options when facing default, and by looking at the structure of the default decision, it removes much of the "fuzziness" and gives a clearer picture of the drivers of default.

Each time a payment is due to the lender, the borrower has two options: Option 1 is to make the payment and Option 2 is to not make the payment. If Option 1 is exercised, the borrower will lose the payment amount, but keep the rights to the property. If Option 2 is exercised the borrower will face default costs and may ultimately lose the property.

If the net operating income (NOI) from the property plus its liquid accounts[1. Liquid accounts include reserve accounts and minimum operating balances held by the [...]

May 20th, 2014|

LGD for Multi-Year Structured Loans

In a previous paper we discussed how to assign a single probability of default to represent the multi-year risk profile of a complex asset such as a commercial real estate (CRE) loan. In this paper we extend the method to cover Loss Given Default (LGD) and Exposure at Default (EAD). Such “compression” of the multi-year risk profile into scalars is required by conventions such as Basel capital calculations which are oriented to assets that can be defined uniquely by their year-one risk statistics, e.g., standard commercial loans and bonds.

In the previous paper we defined the representative one-year PD to be the year-one PD of a bond or commercial loan whose NPV of loss matched that of the CRE loan, assuming that the LGD and EAD were the same, i.e., such that:

Where:

is the number of years to maturity
is the probability of default in year for the CRE loan
is the probability of default in year for the standard bond
is the balance outstanding at default in year

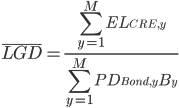
Now with this standard PD for the bond defined, we go one step further to define a single average LGD such that the net present value (NPV) of loss on the bond equals the NPV of loss on the CRE loan1:

i.e.,

where

is the expected loss for the CRE loan in year $$ [...]

  1. For operational simplicity we again assume that the discount rate and interest income are negligible for this purpose.
April 15th, 2014|

Rating CRE Loans Consistently with Commercial Loans

Rating CRE loans according to risk is a long-established practice in the financial industry, however it has become much more important because of the increasing requirements for quantitative risk reporting, e.g., for Basel capital and stress testing. Over the last few decades it has become conventional to rate loans according to their probability of default (PD) and loss given default (LGD). For simplicity, in this article we focus on the PD metric and how that should be interpreted for commercial real estate loans.

For standard retail and commercial loans and for corporate bonds it is assumed that there is a smooth progression in risk from the first year to subsequent years, therefore quoting the first year’s PD is sufficient to uniquely assign the loan to a particular rating or grade. However commercial real estate (CRE) loans are different because they are generally long-term loans with jagged risk profiles over time. The peaks and troughs of the profile are dictated by the deal’s structure and the interaction between the financing and features of the underlying property assets, for example expiration of swaps, lease breaks, rent renewals and refinancing patterns. A typical risk profile for a commercial real estate loan is shown below:

As an example of the disconnect between the first year PD and the overall risk, consider a property with a single large creditworthy tenant. This loan may have much lower risk in the first year than a property with 5 smaller units, however if that large tenant’s lease expires in year three, the risk will peak and may be much higher than that of the diversified property. Similarly an interest-only loan will have low PD in the first year, but a spike of refinancing risk [...]

March 18th, 2014|

Validation of the Specialized Finance System

Introduction
Commercial real estate (CRE) is a complex asset class with a relatively long investment horizon which makes it hard to assess the long term risk of any given deal. Furthermore, as an asset class that tends to constitute a significant portion of the balance sheet, having a rigorous and comprehensive risk management platform should be a key objective of any financial institution involved in CRE lending or investment.

In this note we present results from a recent study of the predictive ability of the Specialized Finance System (SFS). The SFS is a comprehensive risk management platform for CRE that provides in-depth analysis to address the needs of financial institutions lending to or investing in CRE. The results show that the SFS provides very good discriminatory power that can help an institution improve the management of their CRE assets.
Data
The validation study is based on three snapshots (in time) of a well-diversified income producing CRE portfolio plus information about which deals had defaulted and the time of their default1.

The portfolio snapshots consisted of complete deal information, including all financing and property variables (incl. rent-roll) for each deal within the portfolio at a given point in time;

September 2007
September 2008
September 2009

The snapshots thus allowed us to evaluate how the SFS performed in the environment leading up to the onset of the recent financial crisis (i.e., the default of Lehman Brothers in September 2008) as well as the first couple of years into the crisis.
Methodology and Results
We conducted a discriminatory power test by taking all deals in a given portfolio snapshot, e.g., September 2007, and grading them using the SFS with neutral macro-economic outlooks. We recorded the results and [...]

  1. The recorded defaults stretched from 2007 through 2012
January 14th, 2014|

Beyond the Simplicity of DSC and LTV

All Publications >> Risk Methodology

The credit risk of a Commercial Real Estate (CRE) deal is associated with a highly complex and non-linear deal structure. Historically the approach to assessing the risk has therefore been to try and reduce the complexity to a linear weighting of key factors or ratios, e.g., into a scorecard. The weights assigned to each factor may be determined either through expert judgment, or if sufficient data is available, through a regression analysis. A scorecard has the advantage of being easy to explain and simple to understand. A very simple example of such a model would be to have a look-up table using Debt Service Coverage (DSC or DSCR) and Loan-to-Value (LTV) to assess the risk of a CRE deal.

In this paper we will demonstrate that taking such a simplified approach does not capture the essential risk of a CRE deal over time. Two deals with the same DSC and LTV may have significantly different risk profiles when looked at in their entirety. In fact, for the example provided in this paper, the risk (and therefore the economic capital and price) can differ by more than a factor of ten. This has significant implications for institutions that are subject to regulatory capital that is mainly dependent upon only DSC and LTV.

November 19th, 2013|